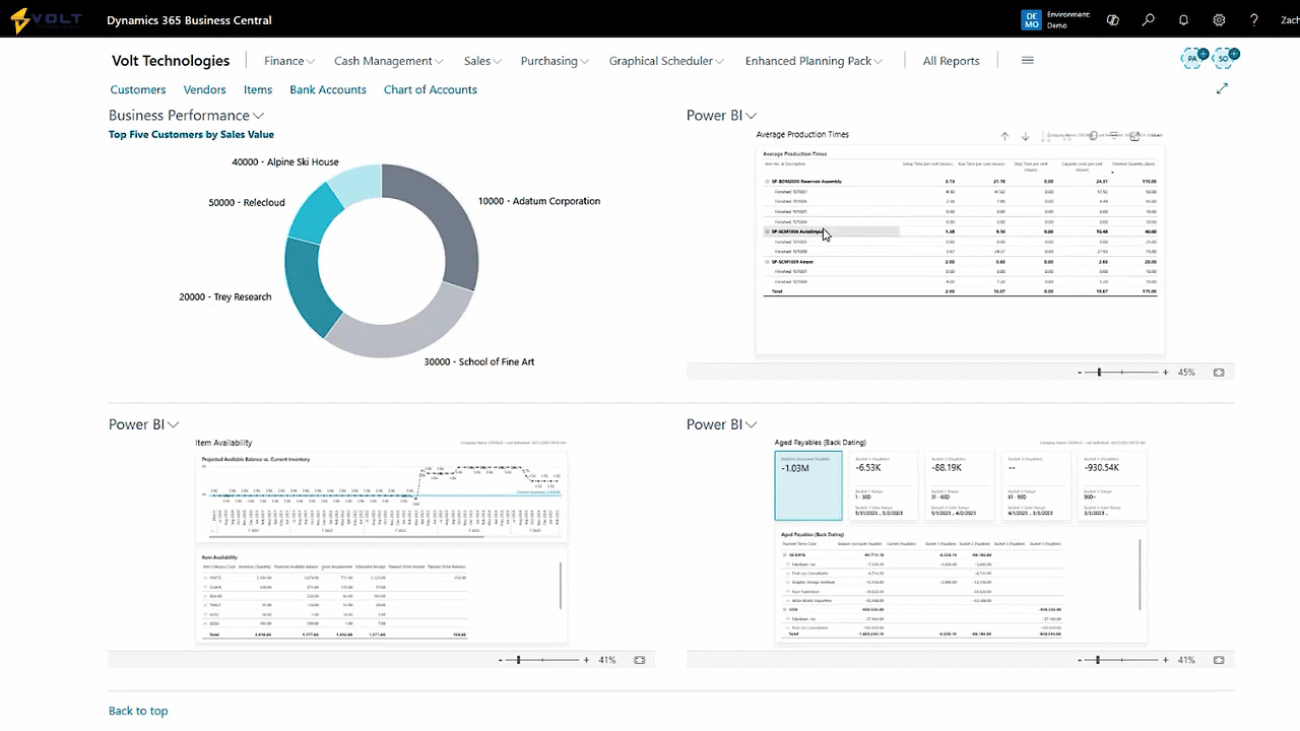
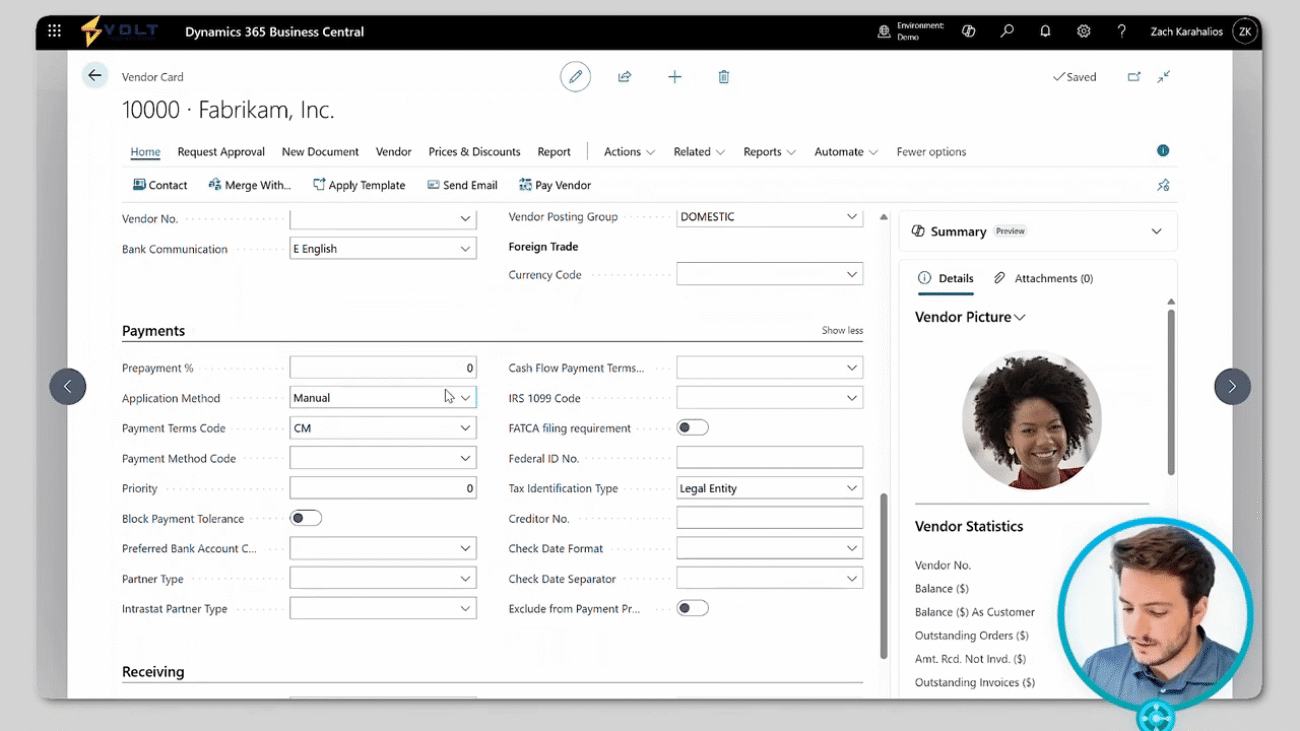
Managing purchases is a huge part of keeping your operations running smoothly. In this video, you'll learn how to create manage purchase orders in Microsoft Dynamics three sixty five Business Central, from selecting vendors and adding items to receiving inventory and posting invoices. Whether you're new to procurement or just new to Business Central, this demo will help you understand the full purchasing workflow. Your vendors keep your business stocked, supplied, and moving forward. In this video, we'll explore how to set up and manage vendor records. You'll learn how to configure payment terms, assign posting groups, and connect vendors to your purchasing workflows, all while keeping your data clean and payables organized. Here is our role center page or the landing screen for Dynamics three sixty five Business Central. For this particular demo, we're gonna be focusing on our vendors. I've quickly favorited that onto my home screen, and I can quickly navigate to my vendors by just clicking on that button here. This is gonna take me to a list of the vendors that I currently have set up within the system. You'll see that I have this in a data list view. We do have the ability to look at this in tiles, tall tiles, or just that standard data list. For this demo today, we're gonna be focusing on our Fabrikom Inc. Vendor. I'll click into our Fabrikam Inc vendor, and here's where we can start to see some of those important or key fields that we store on the vendor card. Things like our vendor number or our vendor name. Do we wanna block a vendor? Do we wanna privacy block that information? When was the last date modified? So when was the last time a user came in and changed a field? What's the balance for this particular vendor? In this instance, we have a balance of twenty one thousand dollars. I can quickly click in here and also see the invoices associated with that, the vendor number, the order, and then the amount. So here we can see the actual amounts that are due per each invoice. I can see my balance due. So currently, none of that twenty one thousand eight hundred and fifty six dollars is due today. I can see my address level information. So this would be the default address that we utilize on a purchase order. You do have the ability, though, to store multiple order addresses or more to multiple remit addresses. We can set up a primary contact, the primary language we can put in our invoicing information. So what's their tax area code? What's that general business posting group? Their vendor posting group? Do they transact in a different currency? What about payments? Do they require prepayments? Do we apply manually? Do we apply automatically? Are the payment term codes? Thirty days, sixty days, current month, cash on delivery? Our payment method, do we always utilize checks, ACH, wire? What's their prioritization level? We can also see things like there are IRS ten ninety nines. We can even identify things like that tax identification type. Finally, we have that receiving information. So when purchasing from this vendor, do we always receive into one particular location? Do we always receive into one particular location? Do we utilize a shipment method code? Do we utilize a shipping agent? Or what about a lead time calculation? Do we know a standard lead time for one particular vendor? If so, we can enter that here, and the system can actually calculate that out for us as we're creating purchase orders. A couple other quick things, we always have the ability to merge vendors, email the vendors, or even directly pay the vendor from the vendor card here. We can see things like their details. So a vendor picture, their vendor statistics, and then their buy from vendor history. So the posted receipts, current invoices, current orders, we can even store attachments, add links, or even add notes. Finally, we do have this new Copilot features that's in preview that will actually summarize all of the data that we have stored on the card today and give you those highlights. So currently, it's searching through the data, and it's letting me know their balance due, the total balances of the vendors, and then the vendor's location as well. So that's just a quick overview of the vendor card within Dynamics three sixty five Business Central. As you're running through the demonstration, if you have any questions that come up, please don't hesitate to reach out to us here at Volt Technologies.
In this demo, the focus is on managing vendor records within Dynamics 365 Business Central to streamline purchasing operations. It covers setting up vendor information, including payment terms, posting groups, and contact details, while highlighting the Fabrikam Inc. vendor as a case study. Users can easily navigate to vendors, view their current balances, associated invoices, and manage multiple addresses. The demo also showcases features like payment methods, lead times for purchase orders, and the ability to merge vendors or communicate directly from the vendor card.
Additionally, new Copilot features are introduced to summarize key data and provide insights on vendor management.